 Just because they print it does it make it true?
Congratulations Miami, the 2011 NBA champions! – NOT. Here it is in print from a Florida newspaper. I guess they never got the memo or checked the score board. Just because it gets printed or makes its way onto the internet, does that make it true? That’s the same way I feel about Phoenix area shadow inventory. Some of the confusion lies in the definition of shadow inventory. Obviously, shadow inventory includes properties that have gone back to the lender but are not on the market. Some also consider homes that have received a Notice of Trustee Sale with a scheduled auction date. Some add to those numbers loans that are seriously delinquent which is 90+ days behind. As you can see, the definition will affect the level of shadow inventory cited by the various experts. There’s also the issue that real estate is local and national commentaries cannot be relevant to individual markets? Many have stated that shadow inventory is out of control and will contribute to a foreclosure Tsunami. Now let’s get the facts for the Phoenix area.
 Fuel for the foreclosure fire – pending foreclosures and Phoenix shadow inventory levels
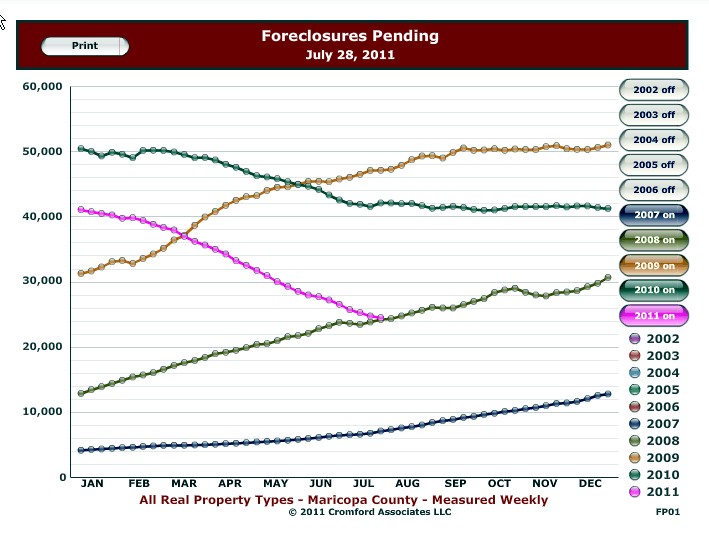
Understanding shadow inventory levels is important because it is a leading indicator of the number of homes that will eventually become foreclosure or lender owned properties which sell at discounts and keep home values from rising. When a lender deems that a home owner falls sufficiently delinquent, a notice of trustee sale is issued advising the homeowner that the property will be sold at a trustee sale auction in 90 days. The graph to the right shows the number of outstanding notice of trustee sale notices with a future auction date for Maricopa county since 2007. A lower number is indicates that fewer properties will go to auction and become lender owned foreclosures. A historical perspective helps identify trends and understand the future supply of lender owned foreclosures. The 2011 trend line is represented by the pink line and shows a favorable trend downwards.
Components of Phoenix Shadow Inventory
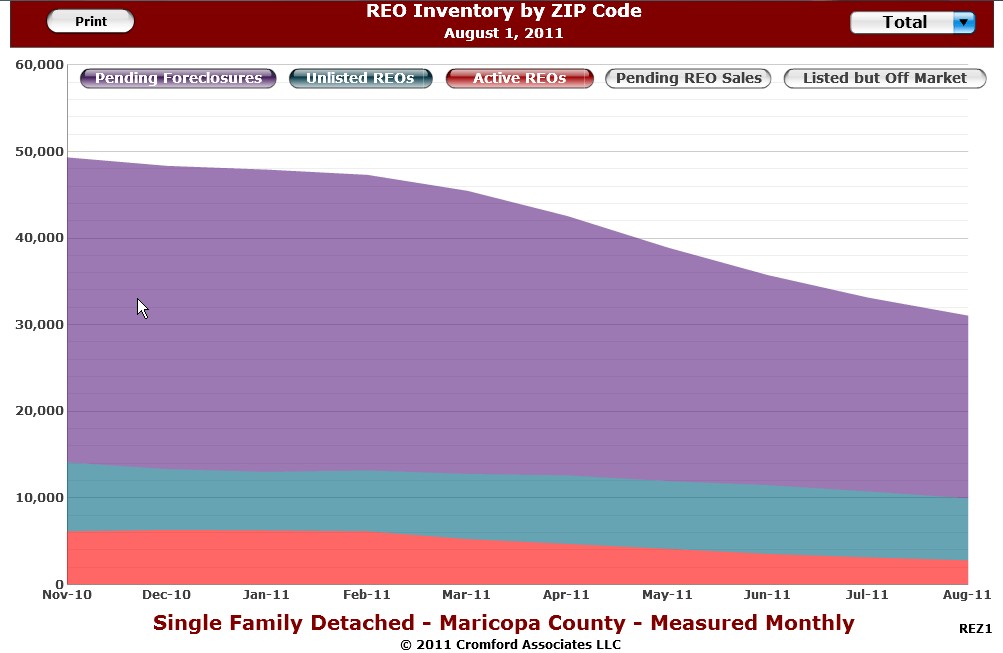
The definition of shadow inventory is will vary and depends on which components are included. I like the definition used by The Cromford Report shown by the graph to the left. The bottom red portion are active foreclosure or REO listings being marketed in the MLS. At the beginning of November 2010, the active lender owned foreclosures were in excess of 6,000. Nine months later at the beginning of August 2011, the number has been cut by more than half, to approx. 2,800 properties. The next component, the Unlisted REO’s, (in blue) are those that have reverted to the bank at auction and are in the process of being prepared to go on the market. Interestingly, this component remains fairly constant between 7,000 – 8,000 properties. The fact that Arizona is a non-judicial foreclosure state helps keep this level lowered than if Arizona was judicial  foreclosure state. The purple portion represents pending foreclosure or properties with a notice of trustee sale. This component has decreased from 35,000 to 21,000, or 40%. These properties may be sold as short sales, achieve a loan modification, purchased at auction or eventually revert back to the beneficiary or lender. A diminishing level of pending foreclosures will result in fewer foreclosured /lender-owned/REO properties later on. The Pending Foreclosures graph above shows a very positive trend for this category since its peak at the end of 2009.
The other component that would be interesting is the number of homes that have stopped paying their mortgage but have not received a notice of trustee sale.
Now you have it, the break down of shadow inventory, what it is and the current trends. If you are waiting for the next wave of foreclosures, it may be a very long time unless there are some fundamental changes. And remember just because you see it something in print doesn’t mean it is necessarily so. Get the real data and understand the trends.
If you would like more information on any homes for sale feel free to call or e-mail or receive updated listings for your favorite community.
Related Posts:
Who really loses on a foreclosure?
Keys to a successful Gilbert or Chandler short sale listing
[rss feed=http://idx.diversesolutions.com/Feed/RSS/2073948 num=10]
If you are experiencing a financial hardship, click to receive short sale information.