 Half way into 2013 – Where’s Phoenix Real Estate Going and Why?
2012 was a good year for real estate in Phoenix, and the question going into 2013 is “Can prices continue to go up like they did in 2012?” Price appreciation in 2012 in many cities resulted in appreciation over 20%, and sellers eagerly want prices to climb back to 2005 – 2006 levels after enduring 4 brutal years leading up to the market bottom in 2011. Buyers are also asking what has happened to distressed properties in 2013? Are foreclosures/short sales coming back? Is the end to the recent price increase right around the corner? Now that we’re more than half way into 2013, the answer to these questions is becoming evident.
The healing continues for the Phoenix real estate market
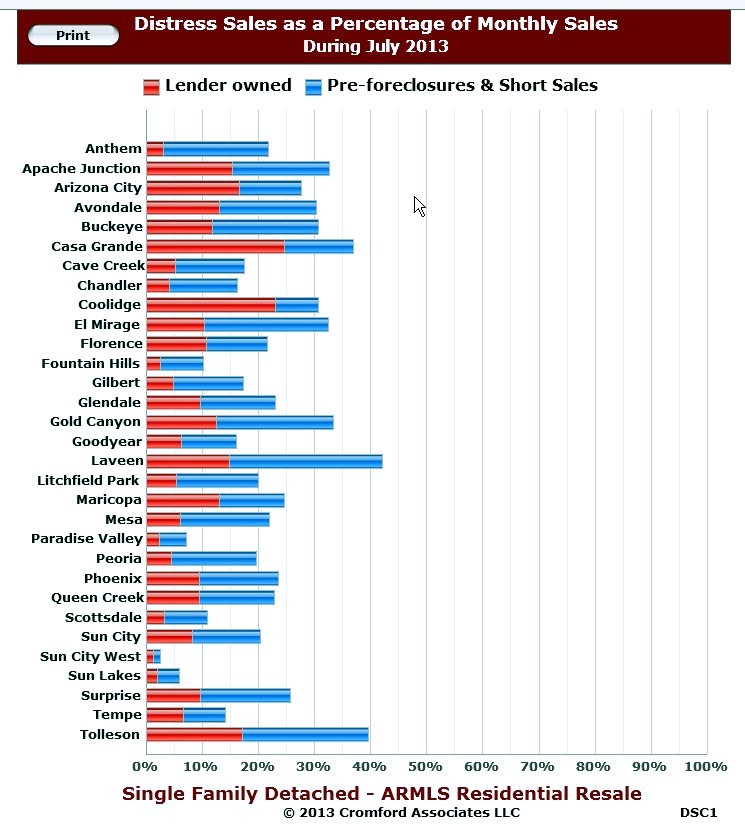
The graph to the right is one of my favorite graphs because it is an indicator of market distress within each city. Instead of throwing out a broad market statistic, the true health of each city is indicated by the percentage of foreclosure and short sale transactions. The real substance to this snapshot is the comparison to previous years. To see how far we’ve come, click back to this same chart 2 years ago in 2011, right when the market was bottoming out. In July 2011, 85% of Avondale’s sales were distress, now 30%. Chandler was over 65%, now its at 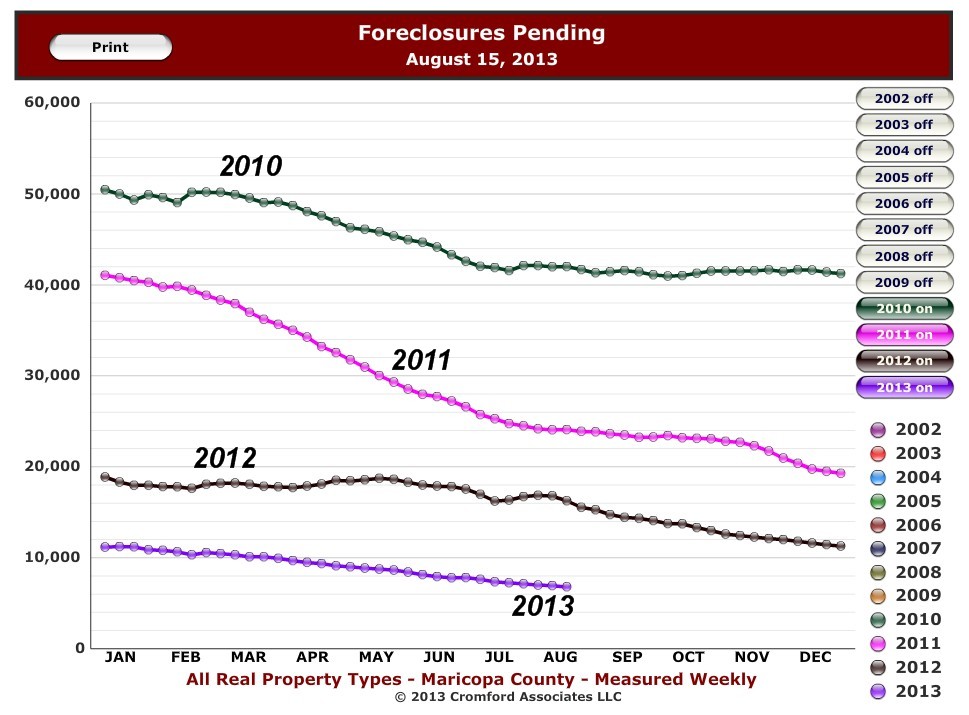 16%. Mesa distressed sales as a percentage of total sales were over 70%, and have now decreased to 22%. Gilbert went from 63% to 17%. Even Tolleson which saw distressed sales over 90% of total sales two years ago have plummeted to less than 40%. Many bargain hunting buyers have also noticed the scarcity of short sales and foreclosures that were a source of low priced properties.
One of the reasons is the continued reduction in pending foreclosures over the past 3 years. By the end of the year, the pending foreclosures should be where they were in 2004! Increasing prices have also reduced short sales by reducing the underwater properties.
Cash Buyers – Are they still out there?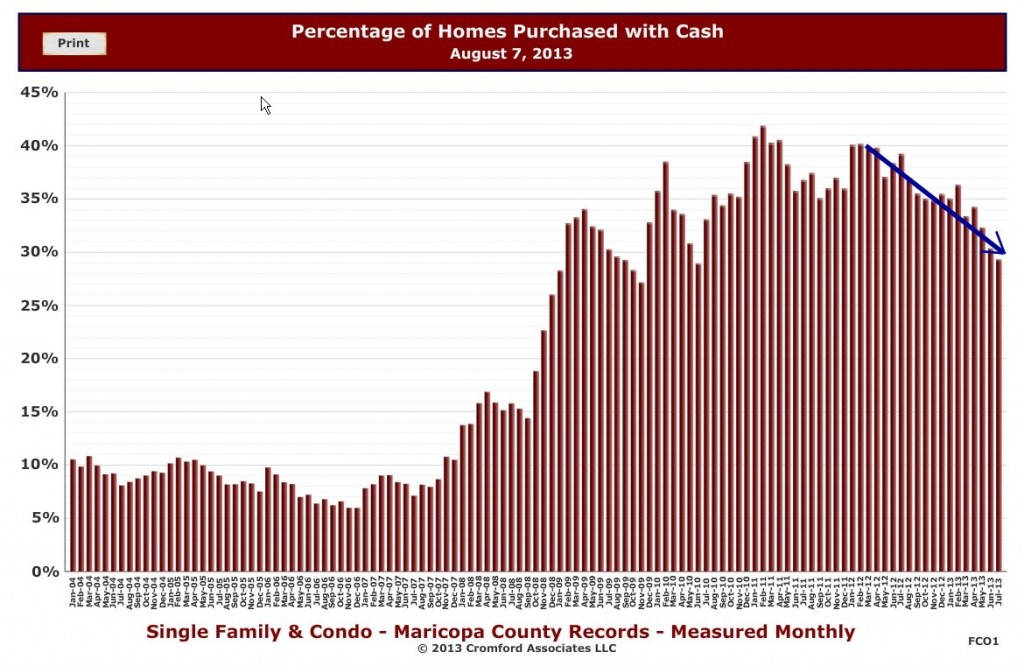

A popular topic regarding who is buying real estate in Phoenix turns to investors. Frequently, first time home buyers will recount how many times they submitted offers only to lose to a cash buyer. A review of the chart to the right shows a steady decrease in purchases of homes with cash since the beginning of 2012. The most recent value of 29% is the lowest since June 2010. Since 2008, the increase in cash purchases, many by investors is supported by the fact that homeownership has decreased from 69.2% at the end of 2004, to a low at the end of March 2013. So are cash buyers still out there? “Yes”, but the trend is downward as prices rise, ROI decreases and distressed sales diminish.
More homes on the market in some cities
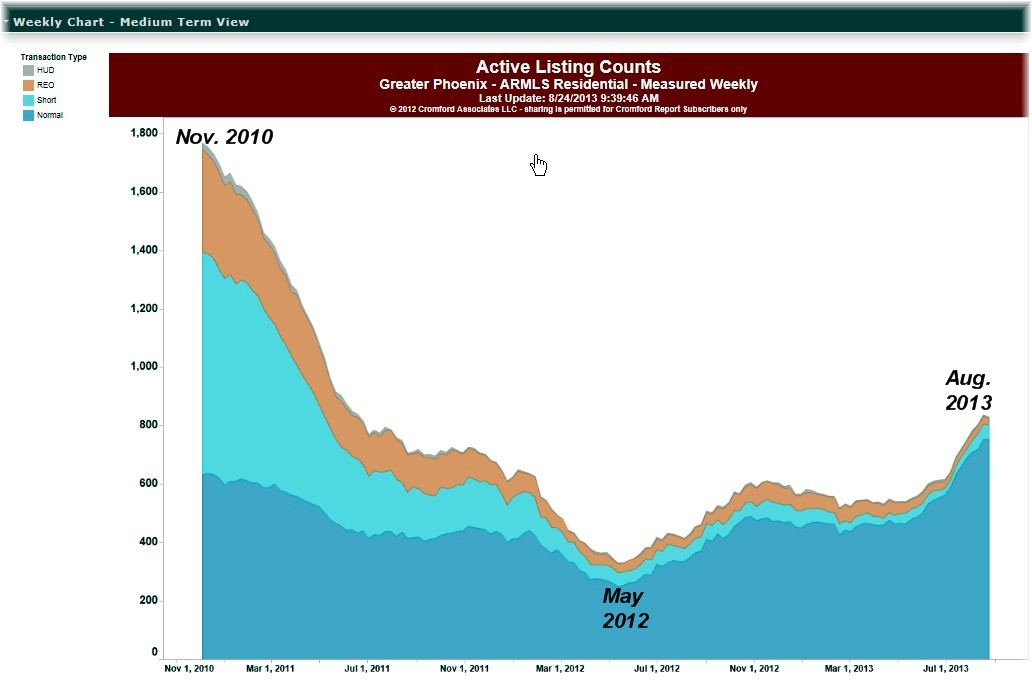
Some valley cities are have seen a rise in inventory. It is amazing to see the dramatic fluctuation we’ve experienced over the last 3 years. The graph to the right shows Gilbert inventory or homes for sale going back to Nov. 2010 when the majority of listings were either foreclosures(brown) or short sales (light blue). Currently in Gilbert and the rest of the valley, listings of normal sales(blue) are higher than they’ve been in at least 3 years. Buyers looking for foreclosures and short sales are finding fewer and fewer. Other cities also seeing a rise in inventory in the last 4 – 6 months include Avondale, Chandler, Glendale, Mesa, Peoria, Tempe, Queen Creek and Phoenix. Some cities that have seen a reduction in inventory or maintain current levels in the last 4 – 6 months; Gold Canyon, Goodyear, Scottsdale, Sun City, Sun Lakes and Surprise. Age restricted communities typically see inventory listings increase the last half of the year.
And Interest Rates. . . .
The effect of interest rates must be factored into the demand side of the equation. Rates in the last couple of months have risen by more than 1%. To see the effect that this can have, consider a buyer that can afford $1,200/month for principal and interest. With a 10% down payment and a 4% interest rate, the buyer can afford a $280,000 home. When interest rates go up to 5%, that same $1,200 per month mortgage allows the buyer to purchase a $250,000 home. That 1% rise in rates reduced the purchasing power by $30,000.
So tell us about prices….
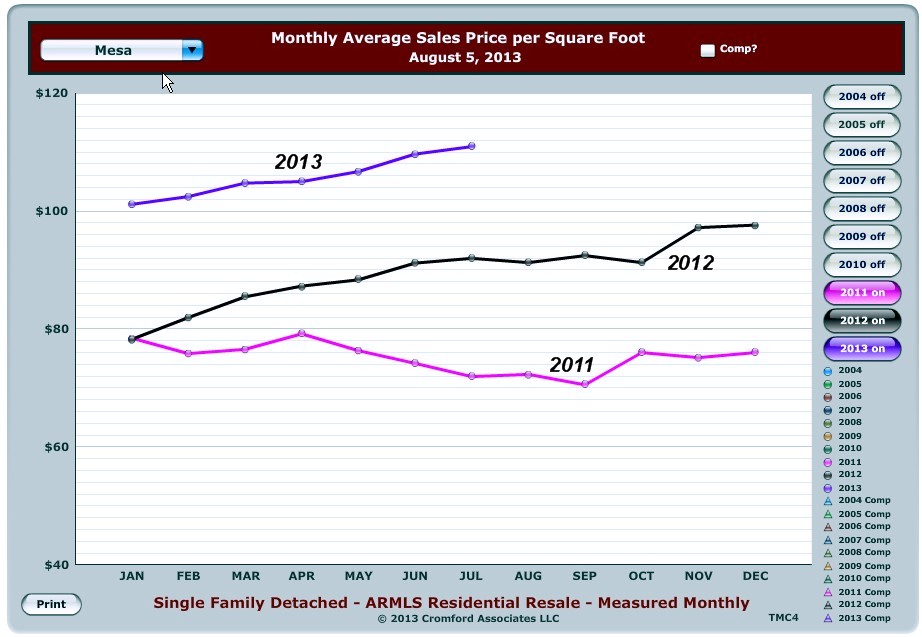 I know that you’ve kept reading so you can get to the good stuff, where are prices going? Every city saw significant appreciation during 2012. For many cities the start of 2013 is an extension of last year. However, there is moderation or reduction of appreciation in others as measured by the average price $/sq.ft. For example, Mesa is showing 13% year to date as seen in the graph to the left, and may come close to that seen in 2012.
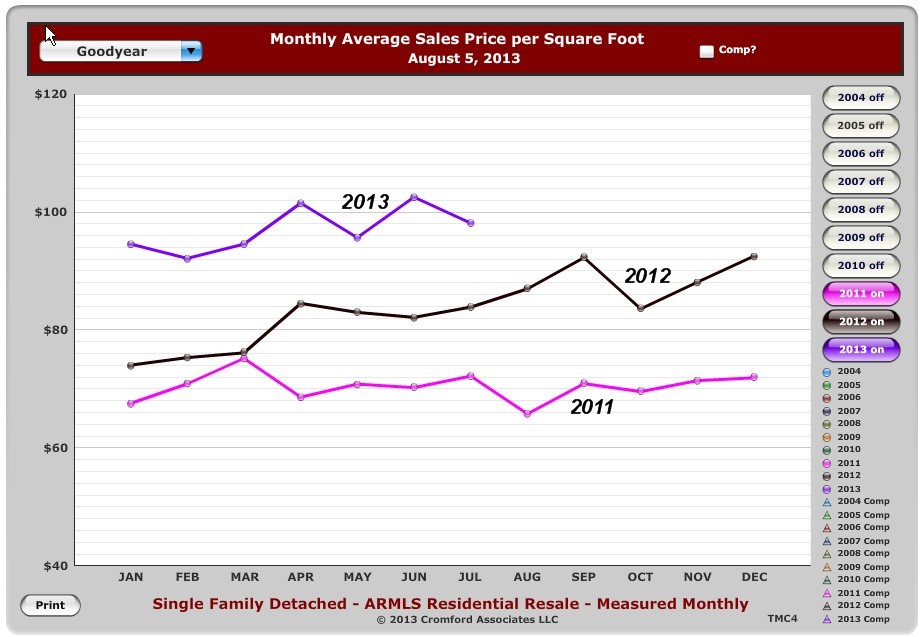
Other cities such as Surprise, Scottsdale, Sun Lakes, Gold Canyon, Sun City West, Casa Grande, Apache Junction and Goodyear have seen weaker appreciation when viewing appreciation measured by Average Price$/Sq.Ft. of sold homes and may not reach the levels they saw during 2012. The graph to the right shows appreciation for Goodyear which is at about 6% year to date appreciation, about half that of Mesa’s.
Cities that have shown strong positive appreciation during the first half of the year include Avondale, Phoenix, Tempe, Chandler, Gilbert, Peoria, Mesa, and Glendale. Obviously, within each city there will be 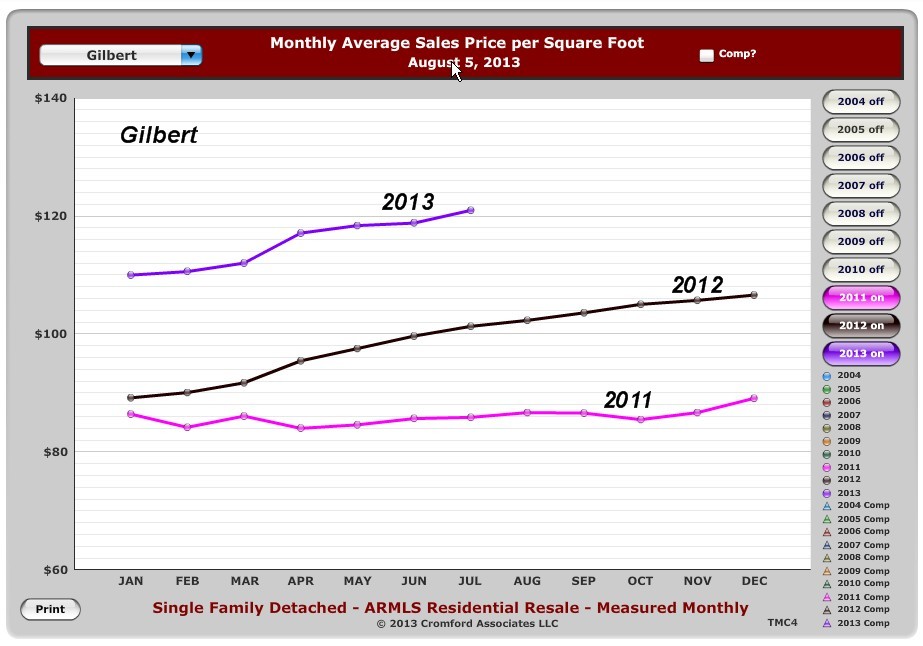 variations depending on square footage, year built, price point, features, condition, lot size, etc. If you’d like me to review comparable sales for your property, click on What’s the Value of My Home. To receive available homes for sale, click on Send Me New Listings.
A reduced appreciation rate compared to 2012 is understandable as prices continue to climb when buyer’s income isn’t increasing as rapidly and the increase in mortgage interest rates reduces buying power. Coupled with the reduction in distressed properties points to the Phoenix market and surrounding cities returning to a more normal market. Wow, its been a long time since we’ve seen one of those!
Other posts in the blog
Are addresses in Phoenix cities that helpful?
Who loses on a foreclosure, the bank? Think Again!
[rss feed=http://idx.diversesolutions.com/Feed/RSS/2070215 num= 8]