Is the real estate market changing?
For 6 years the Phoenix market has been a declining market with some property values declining by more than 50 – 60% 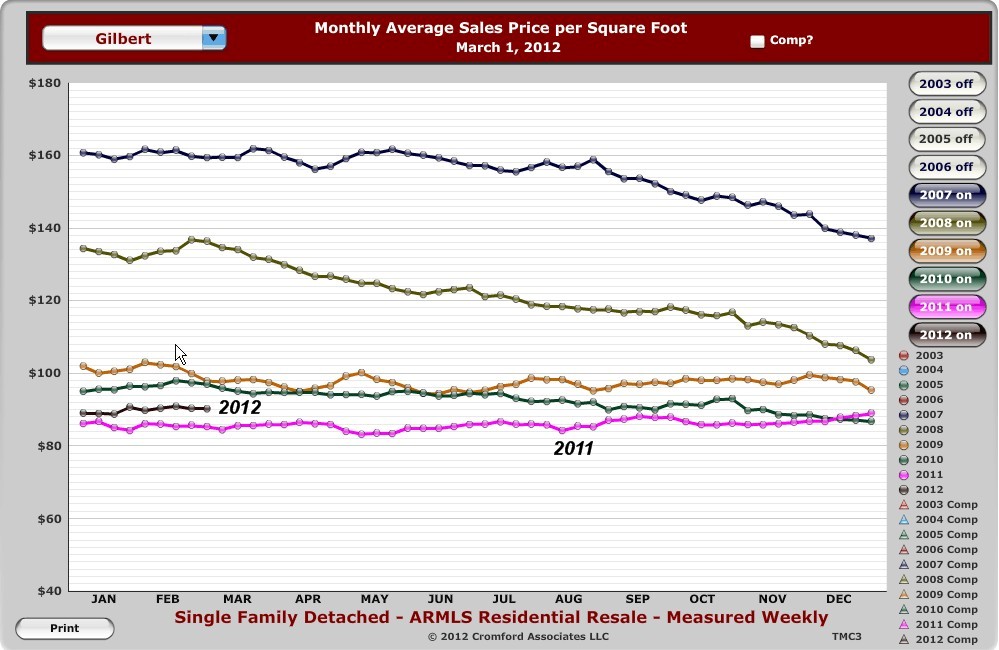 from their peak. At last, many of the fundamentals strongly indicate that home prices bottomed out in 2011, and 2012 will reward homeowners with long awaited appreciation, a word that hasn’t been spoken since 2005. The graph to the right shows sales price/square foot for homes sold in Gilbert. Instead of the typical year end slump, 2011 finished with a positive upward trend that has continued in 2012. In fact, the average price per square foot for Gilbert homes for 2012 is higher than in 2011. The following fundamentals show that 2012 will be a transition year with significant changes compared to previous years.
What’s changed? Answer: Available Properties for Sale
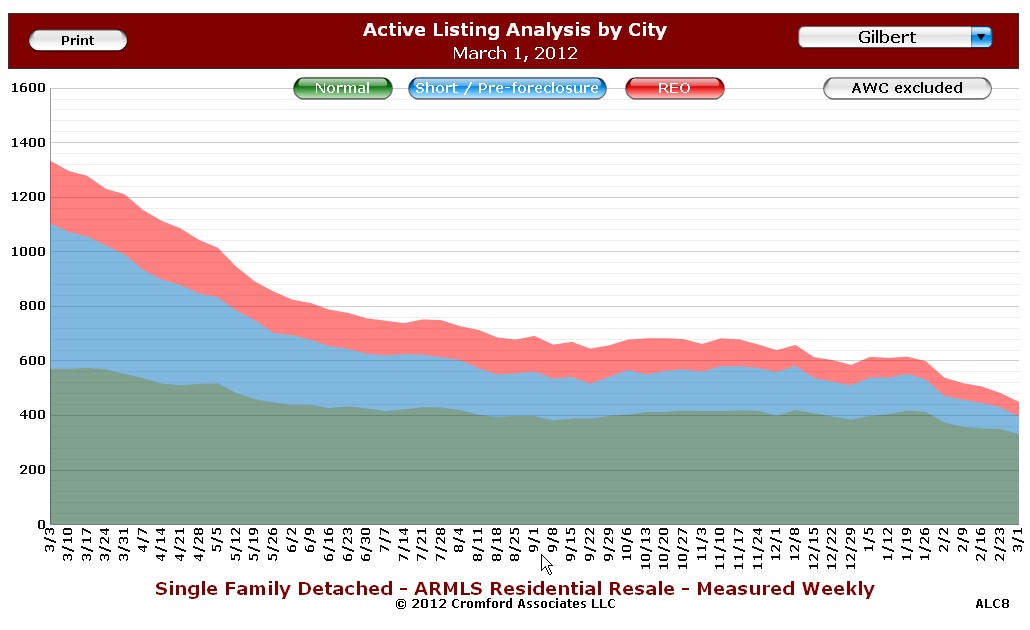
Its surprising that it took this long in light of the fact the available properties for sale have been reduced by more than half in the last year. While the graph to the left is for Gilbert, this same trend exists for most all of the Phoenix area cities. Total available properties for sale in Gilbert went from 2,200 to 800 in a 12 month span. A reduction of almost 64%! Foreclosures represented by the red area were reduced by over 75%. The blue shaded area represents short sales while the greener bottom area are traditional sales. Chandler foreclosures have reduced by 76%, Scottsdale -65%, Mesa – 78%, and Goodyear foreclosure have seen a 80% reduction in a year’s time.
What happened to all the foreclosures?
The source of lender-owned foreclosures is the trustee auction where a portion of the properties revert bank to the lender. Prior to the trustee auction properties receive a notice of trustee sale typically 90 days before the sale. Within the 90 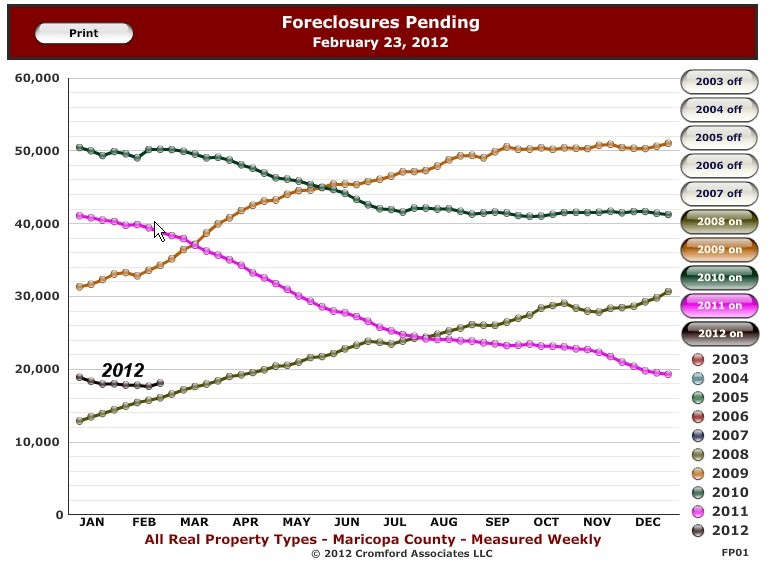 day period the properties are sold as short sales, receive a loan modification, the owners become current on the delinquency, are sold to third parties, or they go back to the lender. The number of pending foreclosures that have received a notice of trustee sale is a good indicator of the level of distressed properties. We can see from the graph for Maricopa county to the right that the number of distressed properties indicated by a pending foreclosure notice has decreased significantly. They will soon be at the lowest point in the last 4 years. Simply put, fewer distressed properties lead to fewer short sales and foreclosures.
Balancing Supply and Demand
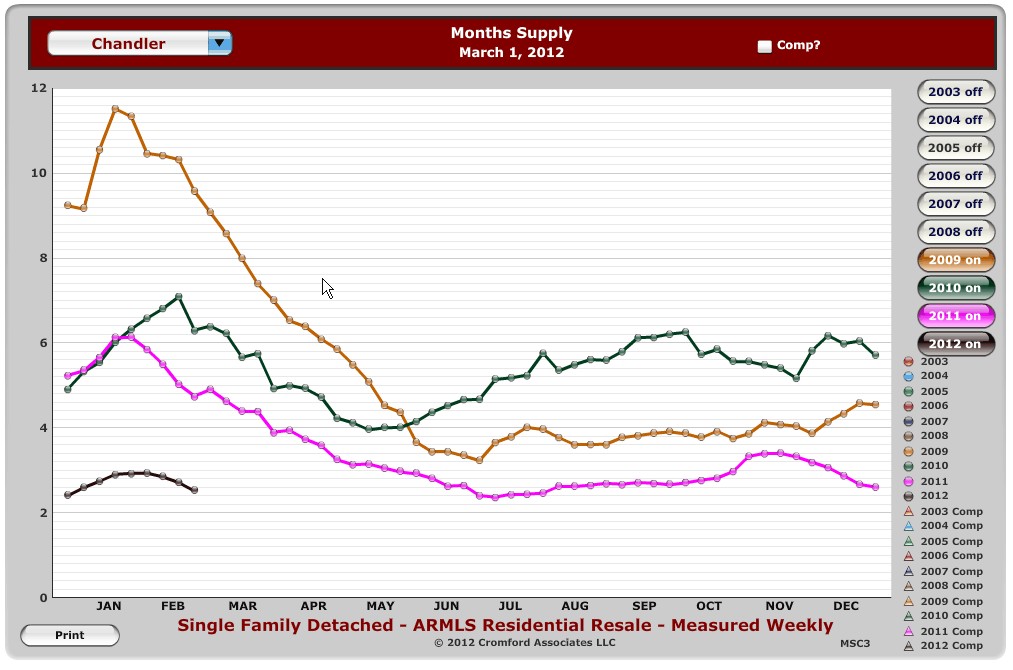 The true pictures becomes apparent by comparing supply and demand. The graph to the left shows the months supply for Chandler which behaves very similar to Gilbert and the trend shown here is very typical of nearly all valley cities. Demand is currently out of balance compared to the existing supply of inventory. With prices at levels almost a decade ago coupled with low interest rates and reduced inventory, the low months supply is a natural result further demonstrating that the long awaited term “appreciation” will become more frequent in real estate discussions. Currently, the months supply for Phoenix area real estate is the lowest in 6 years!
One thing is certain. 2012 will be a year unlike prior years, and be the transition from a period of declining values to the beginning of appreciating home prices.
Related Posts: