Distressed Sales – What a year has done.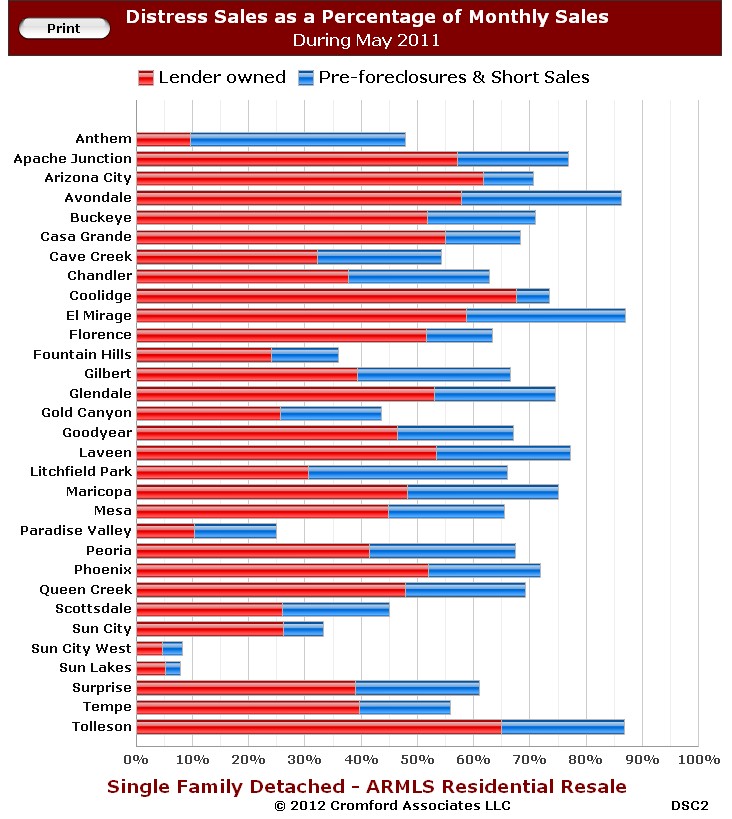
Last year buyers enjoyed a real estate buffet that served a combination of foreclosures/REO’s, short sales, or normal/traditional sales at historically low prices. The inital buyer consultation included an explanation of the in’s and out’s of each. Frustrated sellers knew they were competing with distressed sale pricing as they tried to obtain the highest price for their traditional sale that had seen years of declining value. It was common for most valley cities to have a majority of the sales to be distressed foreclosure or short sale transactions. Distressed sales as a percentage of total sales were above 80% for a couple of Phoenix valley cities! It was the exeception for a city to have less than 50% of total as distressed sales. The chart on the left shows the percentage of sales by each category for May 2011 for each valley city. As you know things change in real estate, so read on to see what has happened since last year.
Change in Phoenix foreclosure & short sales, comparing May 2011 to May 2012
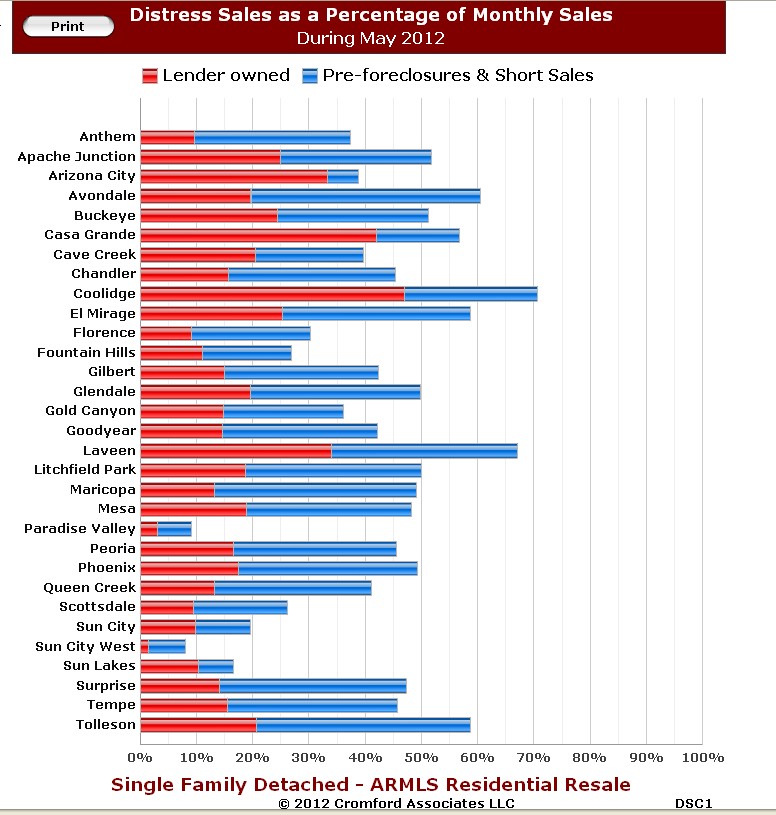 The chart to the right shows the distressed sales(foreclosures & short sales) as a percentage of sales for the month of May 2012 for various cities. Comparing this against the same chart from a year ago offers some good perspective regarding the trend we’ve seen since a year ago.
A couple of observations when comparing the two charts:
* The % of foreclosures/REO’s fell in every city, except for Sun Lakes. In some cases it was in excess of a 30% reduction of foreclosures. Fewer homes are receiving foreclosure notice (notice of trustee sale) than in previous years.
* In most cities, the percentage of short sales as a % of total sales increased from 2011. Banks see a short sale as a more favorable transaction than a foreclosure. Some banks have starting contacting homeowners who are in default and not eligible for a loan modification offering them a relocation incentive to carry out a short sale. Homeowners are also learning about the benefits of a short sale vs. a foreclosure which could account for the increase in the % of short sales from mid-2011 to mid-2012.
* The overwhelming trend is that distressed sales (foreclosures & short sales) are in decline and normal/traditional sales are gradually becoming the norm. As prices increase, which they are doing, the % of short sales will decrease.
Below is a table by city with the % of distressed sales for May 2011 and May 2012 with the third column being the decrease for each city. Distressed sales are foreclosures and short sales. Most all of the cities are seeing double digit decreases in the % of distressed sales for the last 12 months.
City 2011 % distressed sales 2012 % distressed sales decrease in distressed sales
Avondale 86% 61% -25%
Cave Creek 54% 40% -24%
Chandler 63% 46% -17%
El Mirage 87% 58% -29%
Fountain Hills 36% 27% – 9%
Gilbert 66% 42% -24%
Gold Canyon 44% 36% – 8%
Laveen 77% 67% -10%
Maricopa city 75% 49% -26%
Mesa 66% 48% -18%
Paradise Valley 25% 9% -16%
Queen Creek 69% 41% -28%
Scottsdale 45% 26% -19%
Sun Lakes 8% 16% + 8%
Tempe 56% 45% -11%
Tolleson 87% 59% -28%
This is very postive news, and comes as a surprise to many buyers that have been conditioned by the constant and unrelenting national news that foreclosures are increasing and the continued downward real estate spiral. Not in Phoenix. Properly priced homes are now receiving multiple offers and the months supply of inventory is the lowest since 2005 for most cities in the valley, and homeowners can expect double digit appreciation for 2012.
If you have any questions regarding your property value or the trend in your neighborhood, please contact me at 480-326-8571.
Related Posts:
Where’s the real estate market going in 2012?
Keys to a succesful short sale listing
In search of a successful short sale purchase
Upcoming wave of Phoenix foreclosures?
Gilbert Foreclosures/REO’s
[rss feed=http://idx.diversesolutions.com/Feed/RSS/2010180 num= 7]