Reflecting on 2012 and what’s ahead for 2013
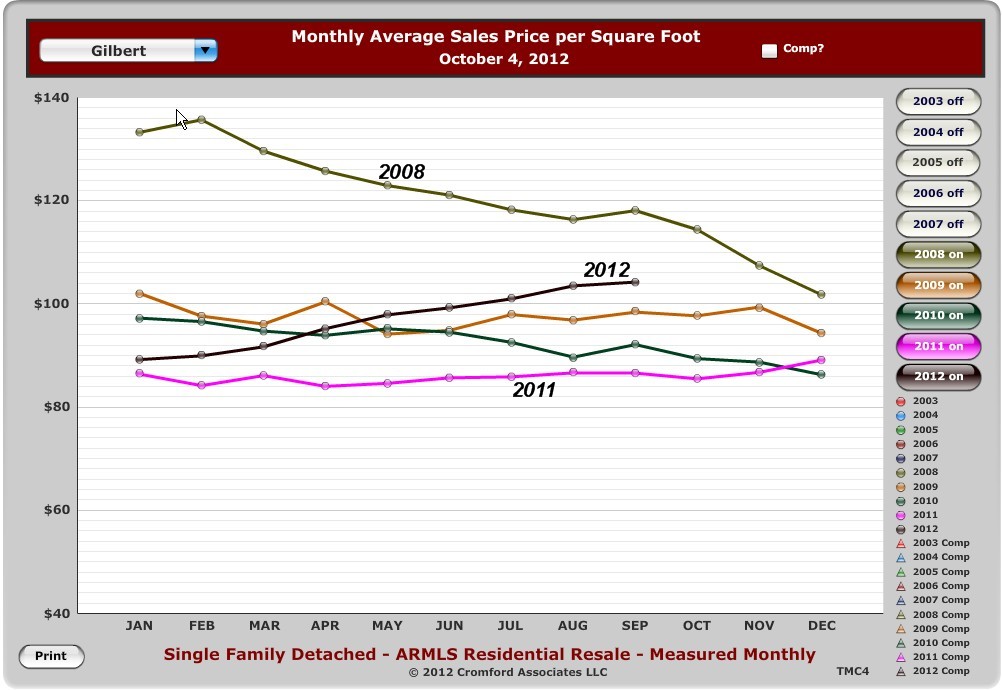 There is no doubt, 2012 has rewarded home owners, to which they say it is about time! Some reports are indicating a 15% – 25% increase in home values over the last 12 months. The graph to the left shows the average $/sq.ft. for homes sold in Gilbert, which has rebounded to pre-2009 levels. Can we expect this favorable trend to continue in 2013, or is this another bubble that will burst in 2013? They tell me I’m an analytic which probably explains why I’ve included charts and graphs to explain my reasoning, so read on.
What’s happening with distressed properties?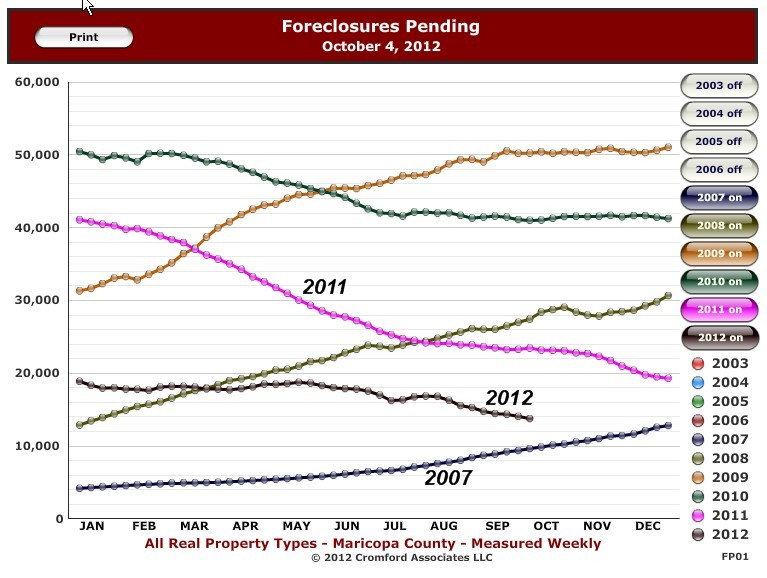
To gain a better understanding of the market, it is critical to understand the market for distressed properties. I like this graph to the right because it shows the pending foreclosures over time. The decrease which began in 2010 and accelerated in 2011, shows why foreclosures have seen a significant reduction during 2012. It is very likely that it will fall below year-end 2007 levels by the end of this year. Pending foreclosures are the fuel for 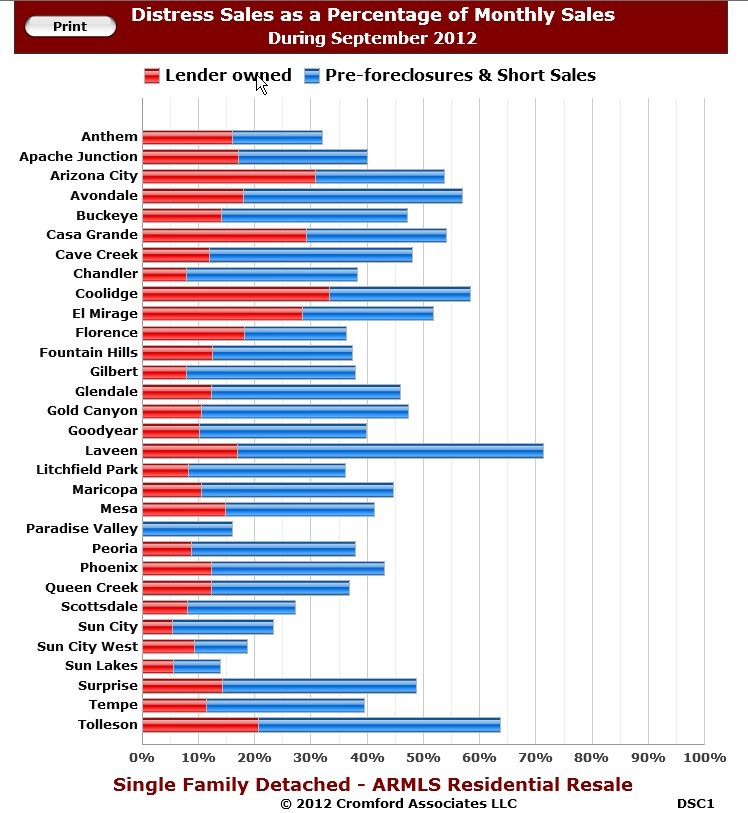 the foreclosures/short sale pipeline so this trend shows that the real estate market is heading towards normalcy.
The specific impact of the reduction in distressed sales can be seen in the graph to the left which shows the percentage of distressed sales by city broken down by foreclosures and short sales. To appreciate where we’re at, we must look back a year ago. Nearly all cities have experienced a double digit reduction in the percentage of distressed sales from a year ago. Instead of torturing you with another graph, I’ll give you the summary.
City %Distressed Sept. 2011 %Distr.Sept. 2012 Change
Gilbert 61% 38% -23%
Chandler 61% 38% -23%
Mesa 66% 42% -24%
Queen Creek 65% 36% -29%
Scottsdale 44% 27% -17%
Surprise 73% 49% -24%
This is over a 12 month period which equates to a 2% decrease per month in many areas. Distressed sales, foreclosures and short sales, will still be around for a while but the trend continues to be extremely encouraging.
What happens when home values rise?
As distressed properties (foreclosures and short sales) are decreasing and home values are rising, this is welcome news to underwater home owners . Before, these home owners could not voluntarily sell their homes. Rising home values provide the opportunity for more owners to participate in a traditional sale which allows more homes to come on the market. Since the 3rd quarter of 2011, the increase in prices has been driven by the lack of supply of homes for sale.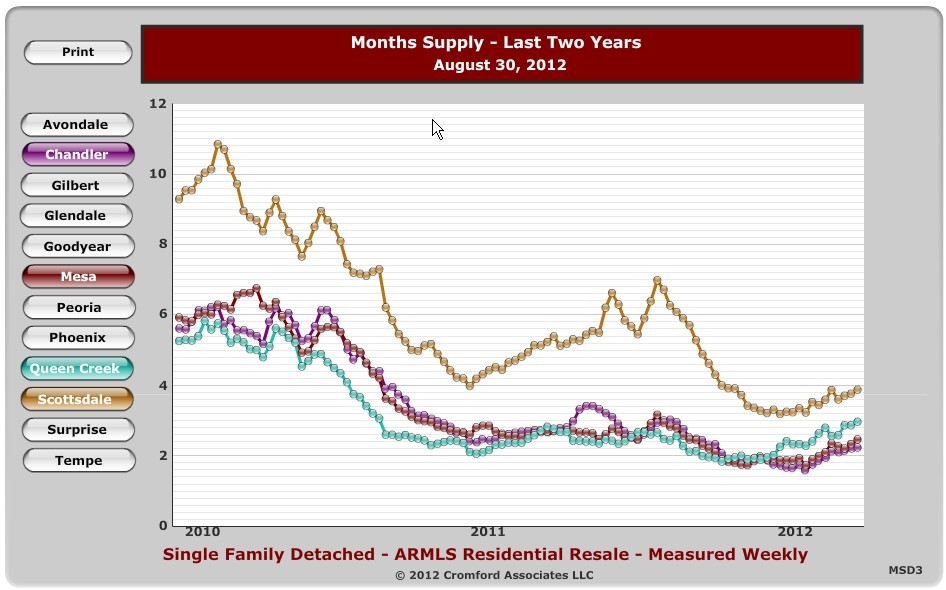 In order to view the balance between supply and demand we must refer to, you guessed it another graph! The months of inventory graph to the right shows that balance between supply and demand. A rise in the available homes for sale with constant demand increases the months of supply because it takes longer for that demand to consume the supply. We are already seeing an increase in the months supply in many cities which means that as prices increase and more homes come on the market, it will take longer for homes to sell and the rate of increase in prices will slow down. A six month supply of homes is consider normal so our market is still very healthy but an update trend indicates a cooling off.
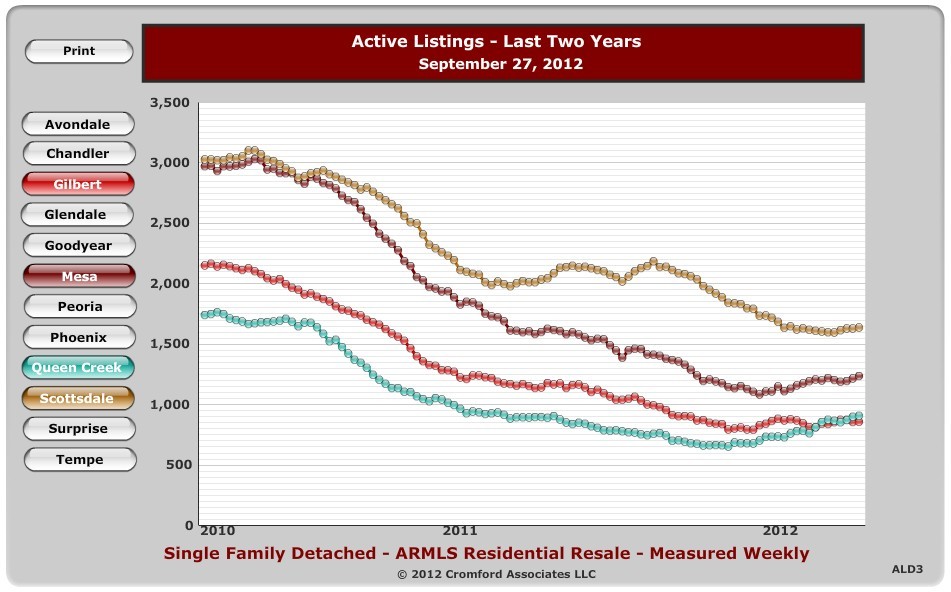 One of the hottest market segments has been lower priced homes that can be purchased and rented out with immediate cash flow offering a significantly better rate of return than other investment alternatives. As prices increase, the ROI comes down and a point will come where the reduced return does not justify the investment and investors will be leaving the market.
As the Phoenix housing market returns to what may be close to a normal market, prices will continue to increase but will be moderated by an increase in the supply of homes. Phoenix was one of the first markets hit by the bubble so the fact that we’re one of the first ones out should not be a surprise. Foreclosures and short sales will continue to be part of the equation but a smaller percentage. Look for continued appreciation in 2013 but not the frenzied price recovery that we’ve seen in 2012.
Your thoughts?
To receive updated properties of homes in the Phoenix area, click on Receive property listings via e-mail and describe the home you’re looking for in detail.
Related Posts:
Distressed Sales in 2012 compared to 2011
Where’s the Phoenix market going in 2012?
Luxury Waterfront Property in Phoenix
[rss feed=http://idx.diversesolutions.com/Feed/RSS/10950910 num= 8]


