A Look Back at 2012 for Phoenix Real Estate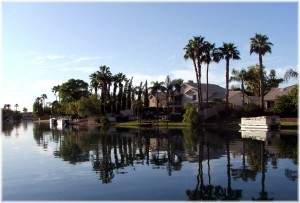
The year in review of 2012 for homeowners was an encouraging one to be sure. 2011 was essentially a flat line, and there has not been any appreciation in home prices since 2005. Therefore, the 12 – 29% increase experienced in nearly all Phoenix metropolitan cities in 2012 was the perfect present indeed! If you’re interested in why prices finally made a U-turn and the chances of a repeat performance, feel free to read on.
Foreclosures, Lender-Owned, Short Sales and Distressed Property in Phoenix
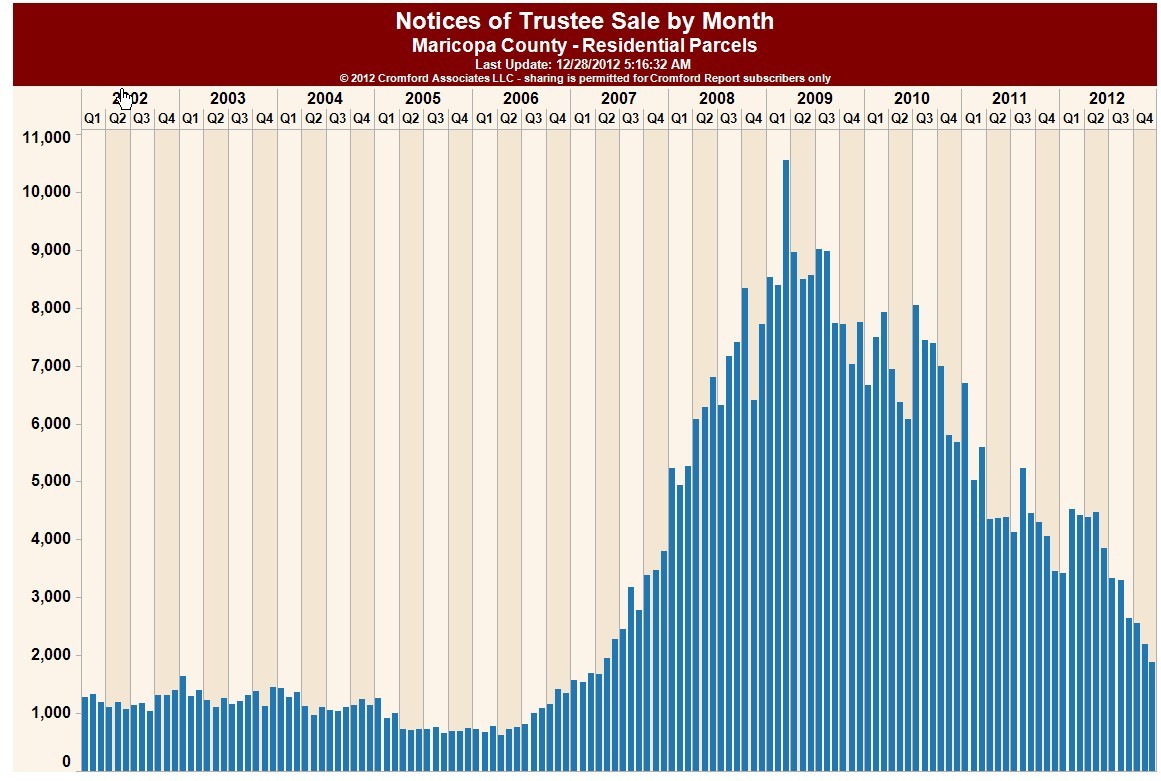 At one time bank owned properties accounted for over 50% of the sales, and when you added in short sales, distressed sales (foreclosures+short sales) were over 75% of the sales in many areas. That trend has been reversed and it is easy to see why when you look at the number of homes receiving a Notice of Trustee Sale which is the mechanism advising the homeowner that the home is in foreclosure. The graph above shows the number of Notices by quarter by year for Maricopa county. Currently we’re approaching levels that were experienced prior to the bubble. The bottom line is with fewer homes going into foreclosure, the fewer bank-owned homes going up for sale. And because Arizona practices non-judicial foreclosure the shadow inventory is minimal.
The effect of this decrease of homes going into foreclosure can be seen in the
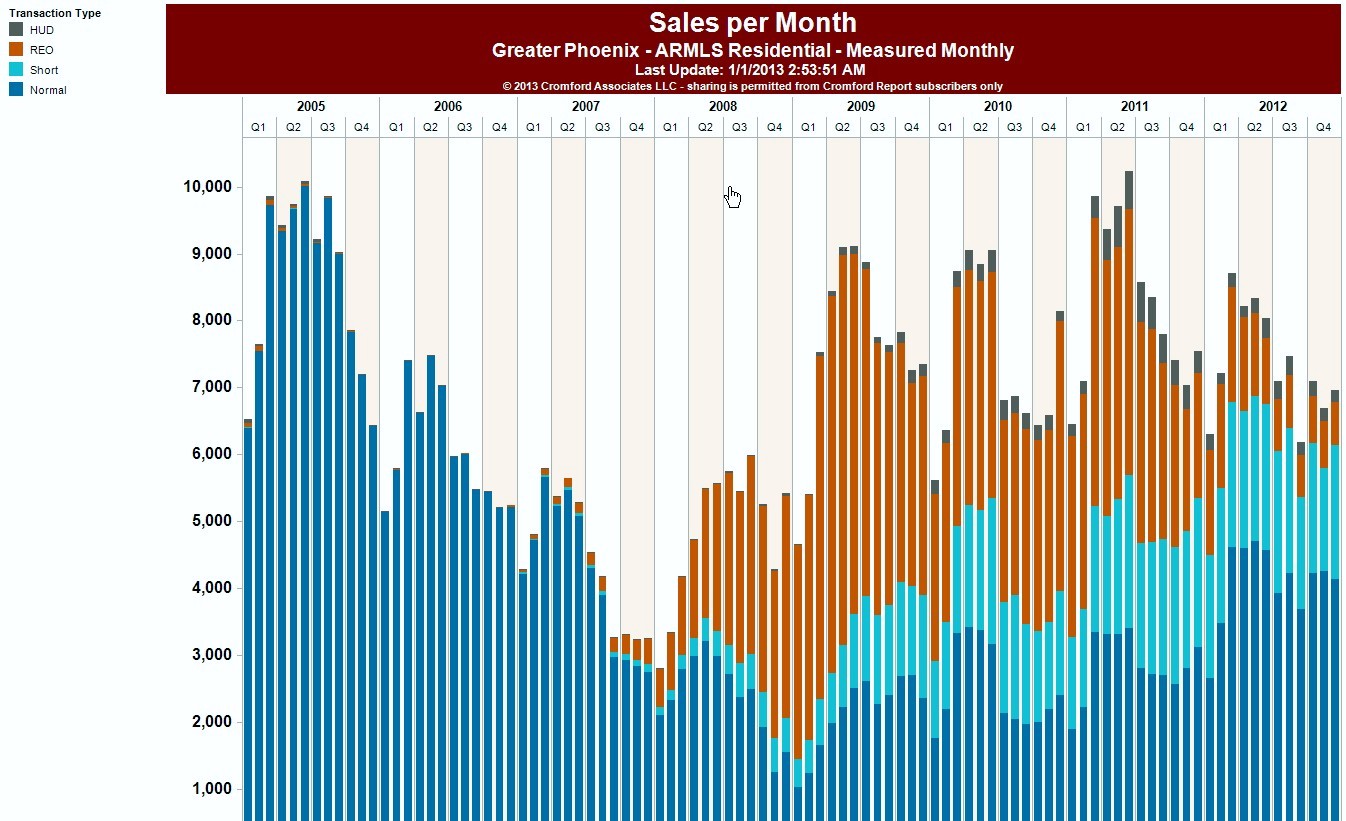
composition of the sales for the last 10 years. The above graph shows the sales by month and the type of sales for the greater Phoenix area; normal in dark blue, short sales in light blue and foreclosure (REO) in brown. From 2008 through early 2011, foreclosures(brown bars) were a significant portion and normal sales fell significantly. We also see that normal sales(dark blue) have increased since 2012 as prices have risen. Short sales have not reduced as quickly as the foreclosures but will as prices rise and economic conditions improve.
Home Value Increases in Phoenix
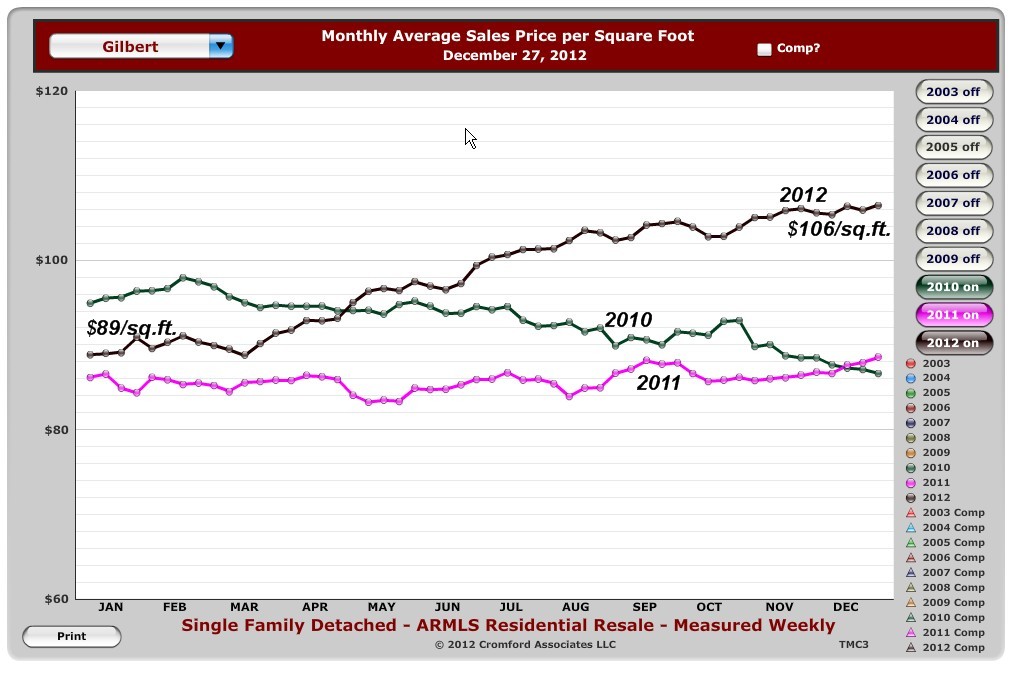 As I mentioned nearly all Phoenix areas have seen increases in the sales prices and $/square foot of homes sold. To the left is a graph for Gilbert showing the average price per square foot for the last three years. At the beginning of the year the average price/sq.ft. for homes sold was $89. At the end of 2012, it has risen to $106/sq.ft., a 19% increase.
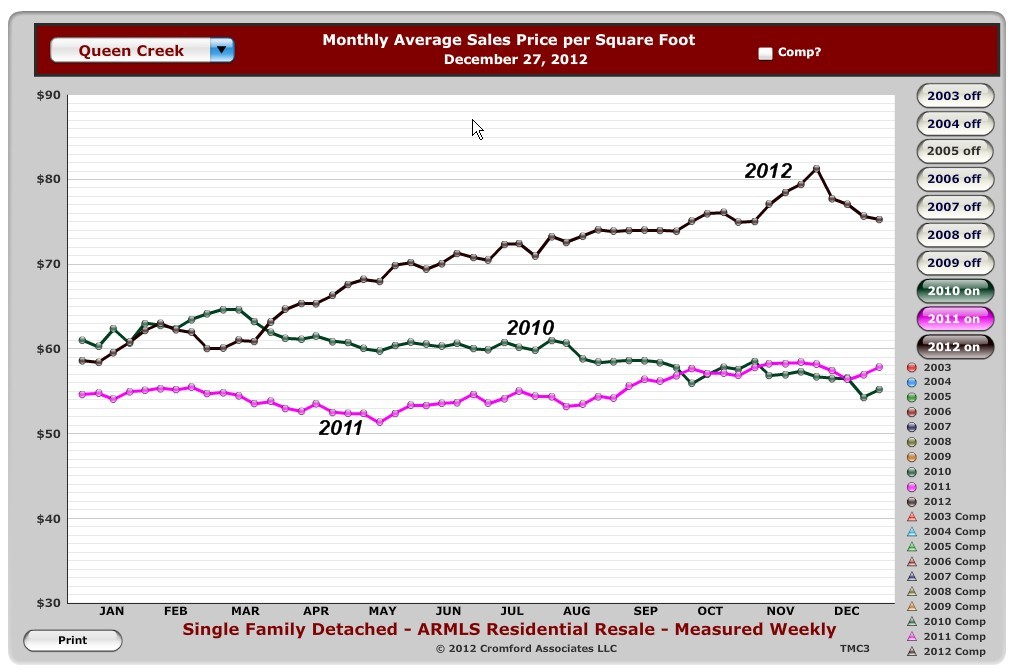 For the city of Queen Creek, we notice that prices on a per square foot basis started at around $58 and ended at approx. $78/sq.ft. reflecting a 34% gain for 2012. This was one of the areas that was hardest hit during the decrease in home prices.
Remember these are averages and will vary depending on the house condition, location, age, size, amenities, upgrades and other variables.
If you’re interested in knowing the value of your home, please click on the following link, What is my home worth?
Inventory – Balancing Supply and Demand
In 2009 – 2010 Gilbert listings ranged between 1,400 – 1,900, during 2012 they were in the 350 – 600 listing range and ended 2012 at approximately 540. This pattern is similar in many other cities.
In the beginning of 2010, Chandler listings were approximately 1,200. At the end of 2012, they were 440. This reduction in inventory of available listings has been the driving force in appreciating home values.
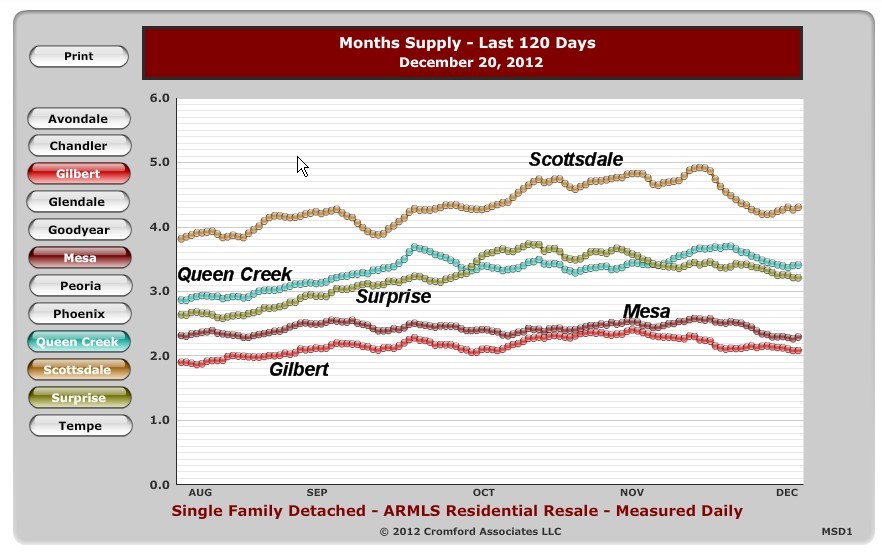 The best way to evaluate both supply and demand is to look at the supply of inventory. The graph to the left shows the months supply of inventory for various Phoenix area cities. When the inventory goes up, this indicates that more houses are available on the market compared to the available demand. A six month supply of inventory is considered normal. Therefore, the graph shows that there is still robust demand for available homes as they come on the market. It is still common for a property to receive multiple offers if it is priced appropriately.
What is in store in 2013 for Phoenix real estate?
The inventory graph also gives us an indication of what is in store for 2013. As prices rise, fewer homes will be under  water and more traditional sales will come on the market at prices than typical short sales and foreclosures. Some buyers may decide not to buy as prices rise and the supply will seek a more balanced level between supply and demand. Again 6 months inventory supply is considered normal. As you can see, each city is at a different stage in returning to balanced supply and demand. I believe prices will continue to rise in 2013, but not at the rate we’ve experienced in 2012. My guesstimate is about half the appreciation rate that we’ve seen in 2013.
If you’re interested in receiving home listings as they come on the market, click on Receive Listings Automatically, or if you’re interested in the market value of your home, go to What is my home worth?
Related Posts:
Distressed sales for 2012 compared to 2011
Who really loses on a foreclosure – the bank? Thing again!
In search of happily ever after with a short sale
Helpful Searches:
[rss feed=http://idx.diversesolutions.com/Feed/RSS/2070215 num= 6]
[rss feed=http://idx.diversesolutions.com/Feed/RSS/4182966 num= 6]
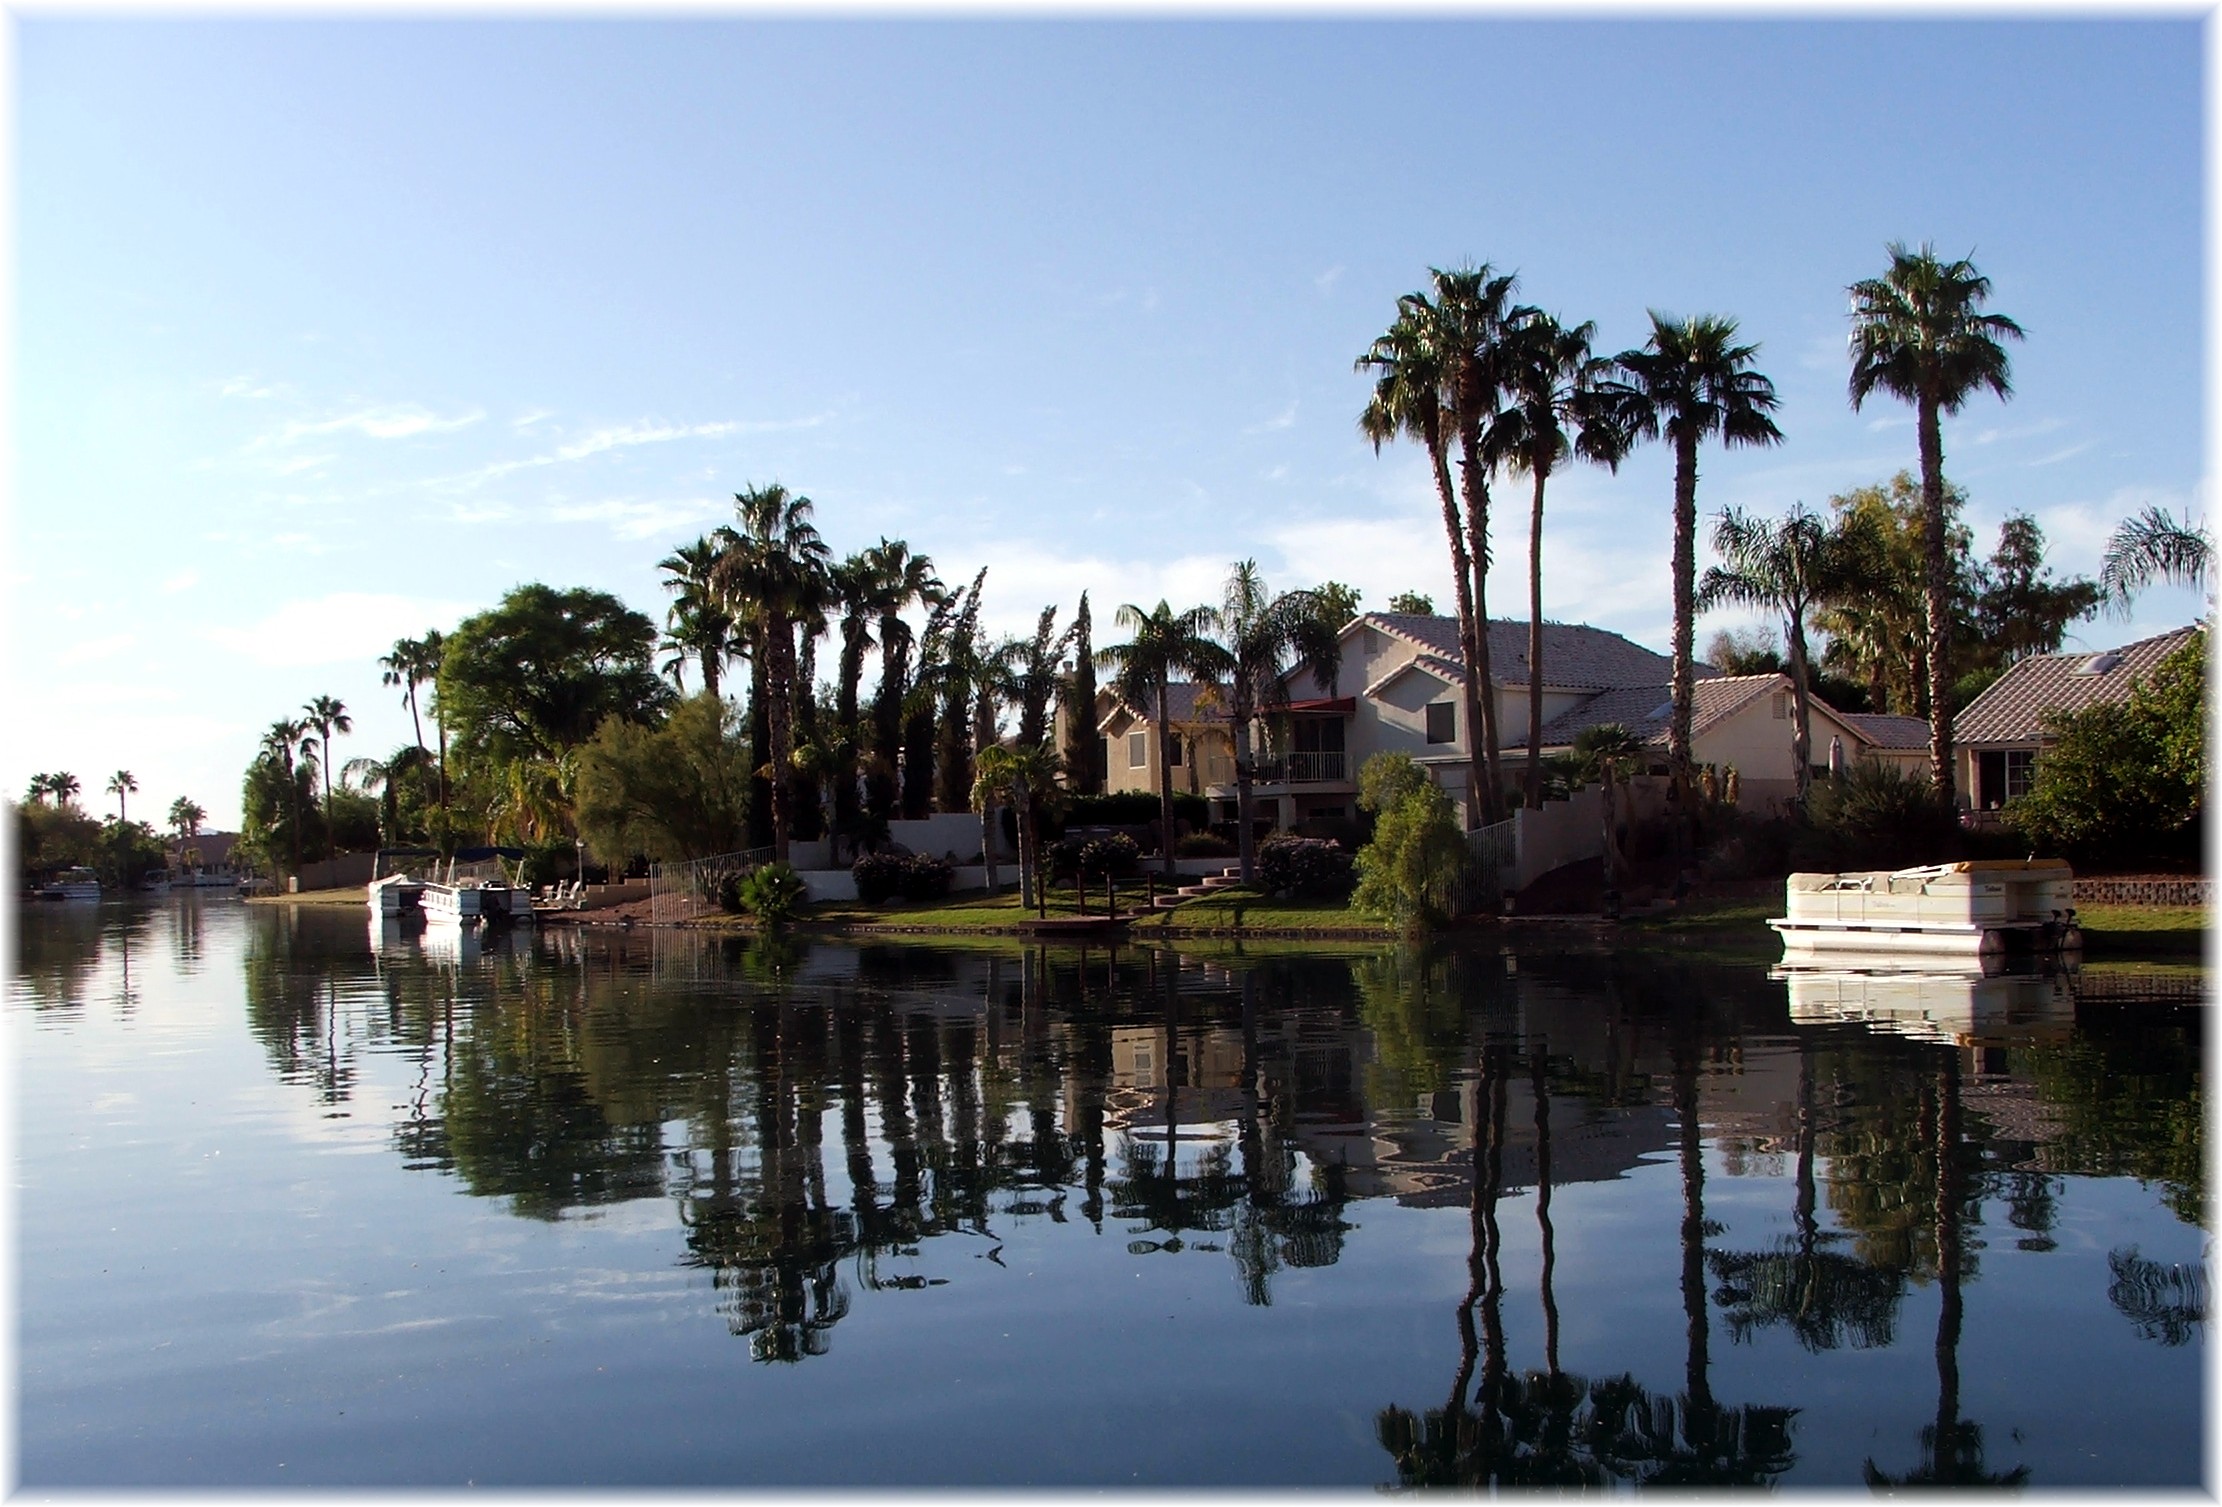
More Chandler and Gilbert waterfront properties are available at Gilbert-Chandler Waterfront Homes