 Phoenix Area Real Estate Review
The Phoenix area real estate market was good to home owners in 2012. It was the first year of appreciation since 2005. Buyers frequently found themselves frustrated by the competion for homes especially those under $200K where there is an abundance of first time home buyers and investor demand. After a robust year in 2012, how is 2013 shaping up?
What has changed since a year ago?
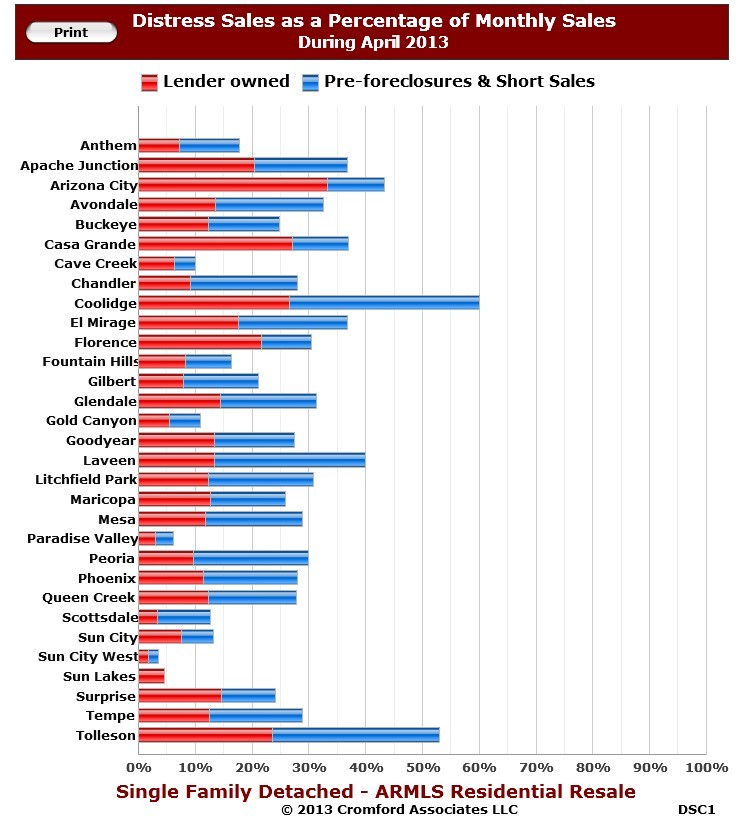
As part of the healing process in the real estate market, the number of short sales and foreclosures continue to decrease.  The graph to the left shows the percentage of sales of short sales /pre-foreclosures and lender owned/foreclosures by city. Compared to a year ago, there has been significant improvement. If you were to look at the same graph from a year ago, each city has experienced a reduction in distressed sales. For example, Gilbert went from 45% distressed sales to 21%! Glendale saw a change from 54% to 31%. Mesa went from 46% to 29%. Chandler saw distress sales fall from 51% to 28%. Scottsdale fell from 25% to 12%. Every city in the Phoenix area saw a decrease in short sale and lender owned properties. To appreciate where we are, you only need to look back to 2011 when the distressed sales were over 60% of total sales in most Phoenix area cities.
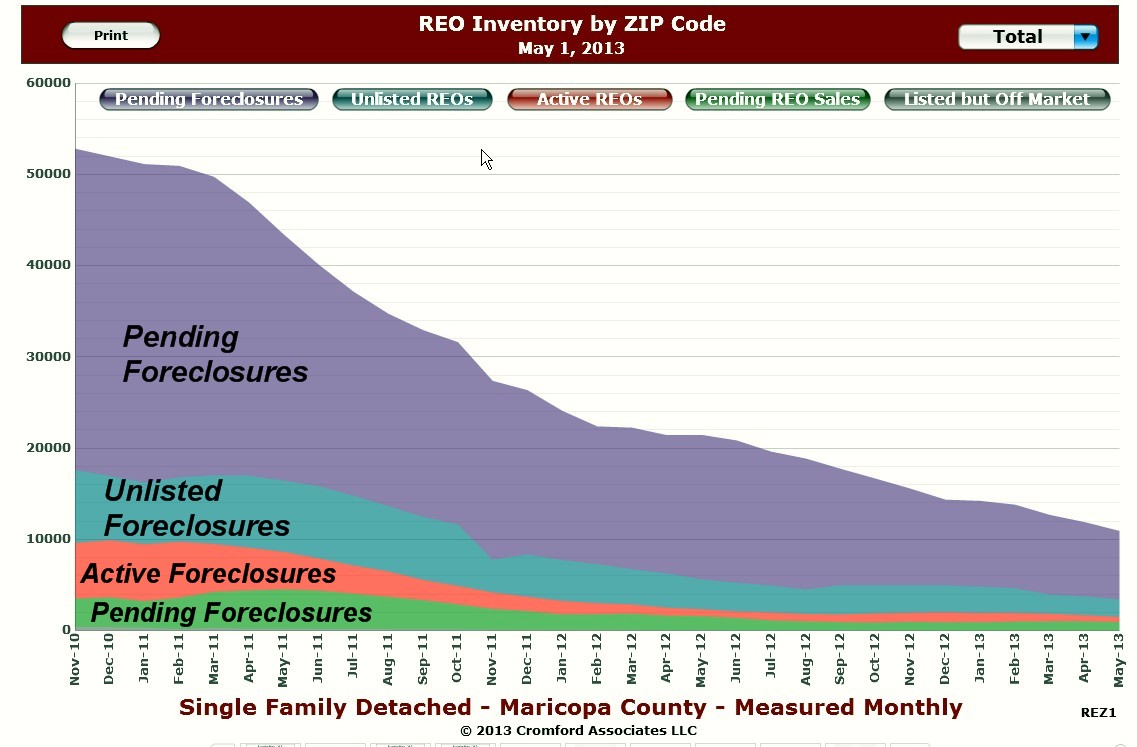
 The reduction in distressed properties, especially lender owned/foreclosures/REO properties can be demonstrated in the active listings over time. To the right is a graph for the last 2.5 years of foreclosure inventory in varying stages for the Phoenix area. Pending foreclosures represent properties that have received a notice of trustee sale which may become foreclosures, short sales, or remedied through loan modifications. The reduction has been significant. When you look at Unlisted Foreclosures, please repeat – No Shadow Inventory!. Arizona is a non-judicial foreclosure state, but that is another blog.
Right Now Its All About Inventory or the lack of
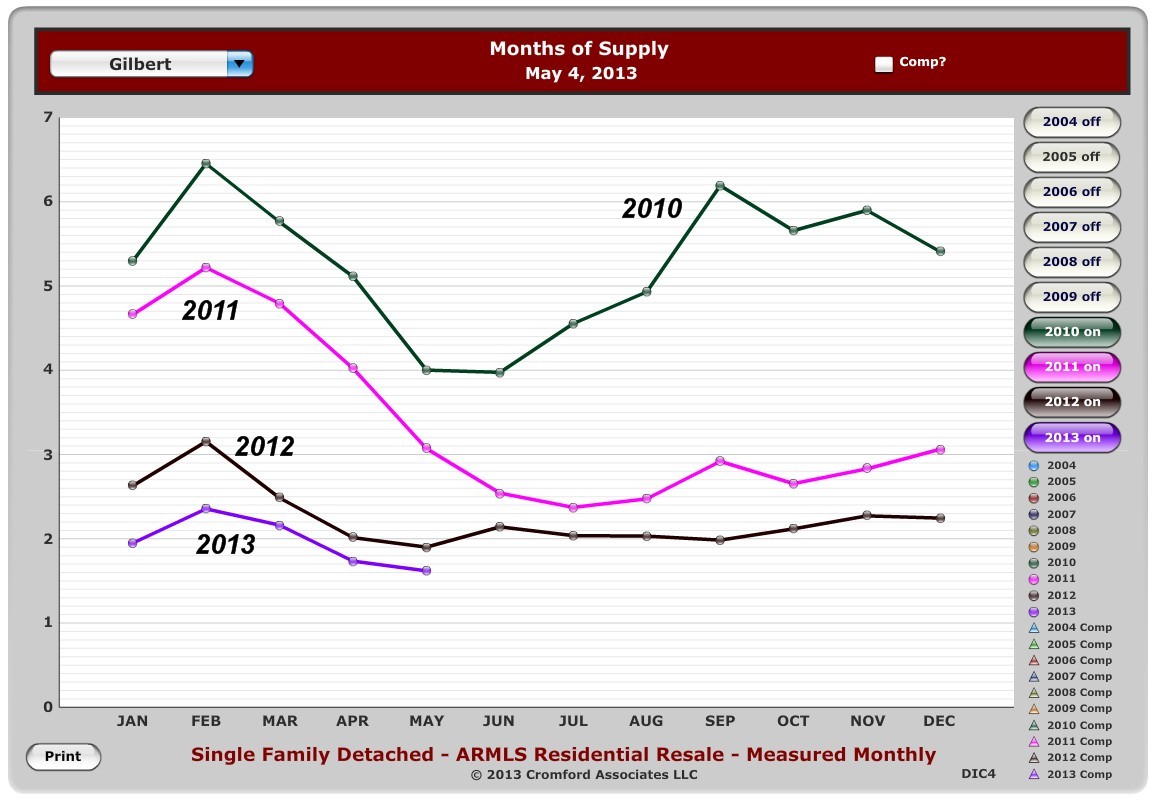
The combination of record low interest rates and buyer awareness that prices are rebounding has created a real estate demand that cannot be satisfied by the  current supply. The result is low inventory and multiple offers on many properties as they come on the market. One way to compare supply and demand is to measure the supply in terms of months of supply. Most cities are experiencing low months of inventory supply similar to the graph to the left for Gilbert, a popular east valley city. The months of supply for Gilbert has not been this low since 2005.
If you would like to receive listings of homes for sale in any city, go to Send Active Listings.
What does this mean for prices?
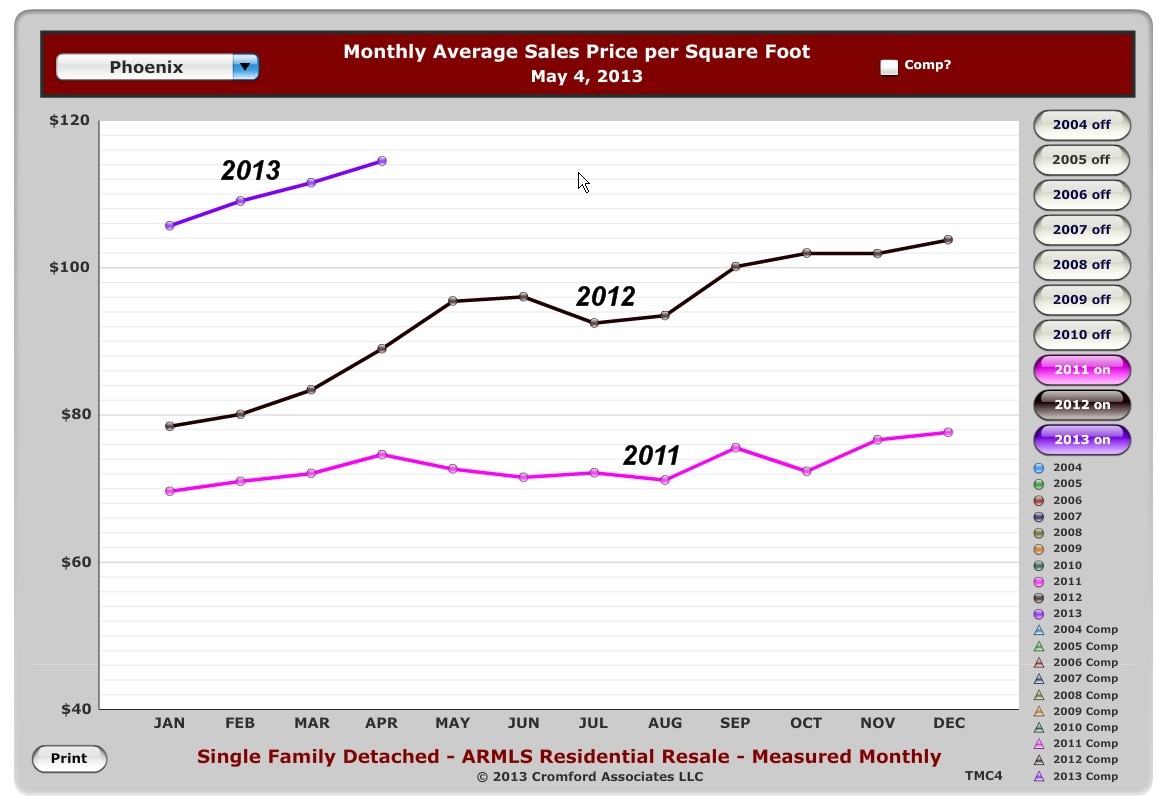
 Low inventory and strong demand translates into rising prices. To the right is a graph for over the last 2 years for the city of Phoenix which contains a diverse cross section of real estate. The appreciation that took hold in 2012 has continued in 2013. Real estate price appreciation can vary between cities and even between neighborhoods. If you would like to know the average sales price/sq.ft. trend for your city, please e-mail me your city and I’ll forward it to you. If you would like to know the value of your home, click on What’s the Value of My Home.
What will the rest of 2013 bring? One long running favorable trend is the decrease in distressed sales which appears will continue for the rest of the year. And everyone has benefited from low interest rates. These historically low rates have motivated buyers to lock in lower mortgage payments compared to years past. At the beginning of the year, I estimated that real estate would appreciate 8 – 12%. Right now I believe that we’ll end up at the higher end of that range. Your thoughts?
Related Posts
Over-Priced Fannie Mae Foreclosures and Short Sales
Phoenix Area Distressed Sales 2012 compared to 2011
Who Really Loses on a Foreclosure? The Bank – Think Again
A Look Back to Real Estate for 2012
[rss feed=http://idx.diversesolutions.com/Feed/RSS/10950910 num= 6]


